Parasol Navigation: Optimizing Walking Routes to Keep You in the Sun or Shade
Sun and shade have a strong impact on how many of us pick a route to the places we want to go. For me personally, direct sun is the devil himself. The point of Parasol is to leverage knowledge of the environment to help people make these decisions. This is analogous to how we use popular navigation apps like Google Maps or Waze to navigate around traffic: we want to avoid congested routes and the apps use extra information about current conditions to help us do so. The Parasol navigation app knows more about where it is sunny and shady than you do, and can help you stick to whichever is your favorite.
I built Parasol over 4 weeks as an independent project with Insight Data Science. I cannot recommend this fellowship highly enough. If you are a PhD considering a career in data science, apply to Insight. If you are a company looking for newly minted data scientists, become a partner.
For the interested, all of the code for this project is posted on Github at: github.com/keithfma/parasol.
TL;DR
Parasol uses high-resolution elevation data to simulate sunshine and constructs
routes that keep users in the sun or shade, whichever they prefer. You can
try out the app at parasol.allnans.com.
The app is no longer live, but you can still check out the demo video below:
Approach
The approach behind Parasol is surprisingly straightforward. First, I build a high-resolution elevation model. Next, I simulate sun/shade using the position of the sun for a given date and time to illuminate the elevation grid. Then, I compute a cost function that incorporates sun/shade as well as distance for each segment of the transportation network. Finally, I apply Dijkstra’s algorithm to compute the shortest path given this custom cost. All of this is wrapped up into a friendly web application.
To make this a little easier to follow, the figure below shows a high-level schematic of the inputs and outputs of the system. Later sections provide some insight into how I designed and implemented each part of the system.
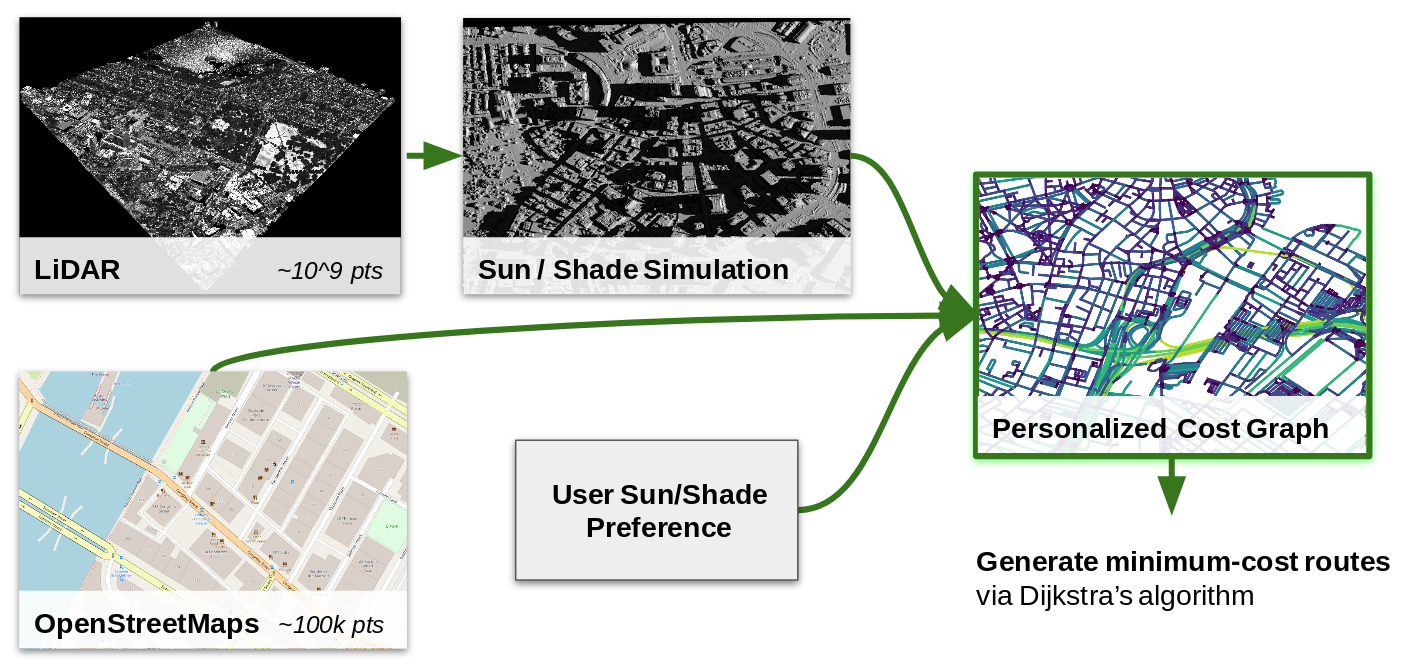
The input data I used are:
- NOAA LiDAR elevation
- OpenStreetMap via Overpass API
- User supplied route endpoints and sun/shade preference
The tools I used are (faaar from exhaustive):
- Python with all the usual data science packages
- Point Data Abstraction Library (PDAL)
- PostgreSQL with PostGIS, pgpointcloud, and pgRouting extentions
- GRASS GIS (r.sun for solar simulation)
- Flask, Leaflet, Geoserver, Apache (for the web app)
Gridded Elevation from LiDAR
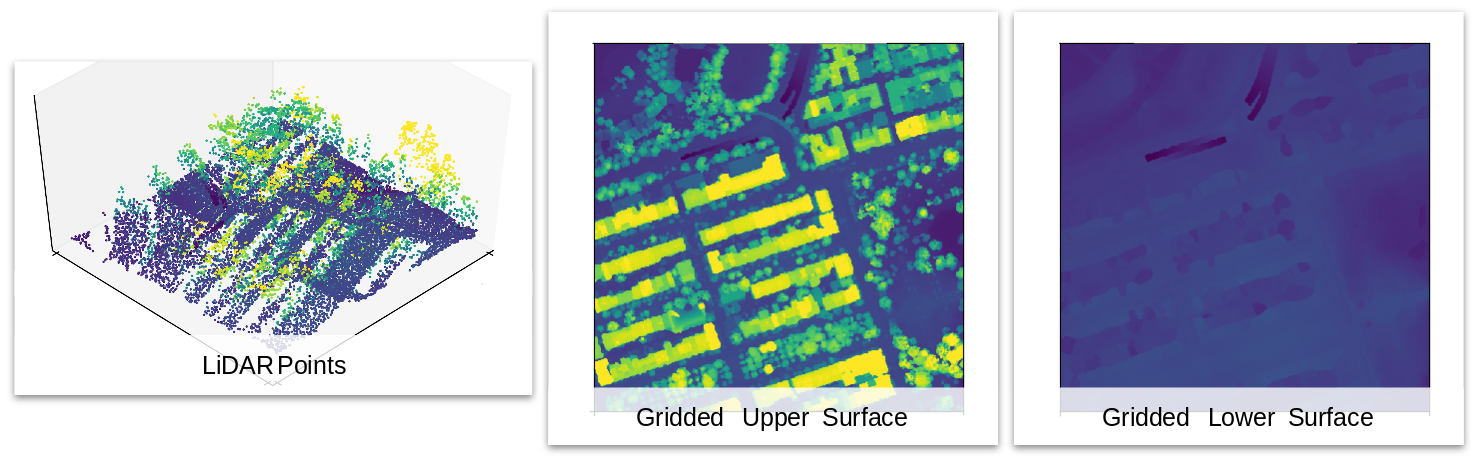
To run a decent shade model, I needed a decent elevation model. My goal was to build two elevation grids: one for the “upper surface” including buildings, trees, etc., and one for a “lower surface” that excludes these things. For my purposes, the sun shines on the upper surface, and the people walk on the lower.
LiDAR (Light Detection and Ranging) scan data is a near perfect data source for my application. The raw data consists of a “point cloud”, meaning a long list of (x, y, z, …) points, with a <1 meter spacing. Even better, each laser shot can have multiple returns, so that it is possible to resolve both tree top canopy and bare ground elevation.
The first challenge was separating the point cloud into upper and lower subsets (i.e., tree-tops and bare ground). The are a few well-established methods for doing so, but it turns out the LiDAR data I used were pre-classified by NOAA. As these classifications were quite good, I just used them straight out of the box.
Now I had two point clouds, but still no grids. LiDAR data are not on a nice regular grid, but rather scattered about with irregular spacing. Because there is some noise in the measured elevation, I needed to smooth (not interpolate) the raw data and then resample on a regular grid. This is trickier than one might expect, especially because features with sharp edges (e.g. buildings) are important to the sun/shade simulation. I used a nearest-neighbor median filter, which returns the median value of the k-nearest neighbors for each point on the output grid. This has the nice effect of both smoothing the noise in the data and preserving sharp edges. Median filters are common for image de-noising, but I had to implement my own to work with scattered input data. For the interested, you can find the code for my nearest-neighbor median filter here — it is quite simple!
Simulating Sunshine
To simulate sun and shade, I use the GRASS GIS module r.sun to compute insolation on the upper surface grid for a given date and time. This simulation includes raycasting for direct sun, as well a diffuse illumination from scattered light. It is not fast, nor is it easy to use, but it gets the job done.

I also did a quick qualitative validation in which I compared simulated shadows to the observed shadows in high-resolution aerial photography (from the NAIP program).
To account for shade cast by trees, I set the insolation at all pixels where the upper surface is higher than the lower surface (i.e., where the user will be walking below some object) and set it to the minimum observed insolation in the scene. A more sophisticated approach might account for sunlight angling in under the trees, or for the changing leaf cover in each season, but these features were sadly out of scope for this quick project.
Sun and Shade Cost
Dijkstra’s algorithm (which I used) finds minimum cost routes between nodes on a weighted graph. The weights are essentially a cost incurred for traversing between two nodes. An obvious choice for the cost in a navigation application is the distance between the nodes. For Parasol, I needed a new cost function that included sun/shade exposure in addition to distance. The key requirements for the cost function were:
- Incorporate both insolation and distance
- Allow for routes that prefer sun and well as routes that prefer shade
- Have a minimal number of free parameters (ideally one) so that it is easy for users to indicate their preference
- Be non-negative
It turns out I was able to write the cost as a simple weighted average of a “sun cost” and a “shade cost”:
\[\text{cost} = \beta \cdot \text{sun_cost} + \left( 1 - \beta \right) \cdot \text{shade_cost}\]The weighting parameter (\(\beta\)) reflects a user’s preference for sun or shade. It ranges from 0 (total preference for shade) to 1 (total preference for sun).
The “sun cost” term is the path integral of the insolation along each segment of the OpenStreetMaps transportation network. This is related to the amount of sun you would absorb by walking a given segment. The beautiful thing about integrating over the length of each segment is that the cost implicitly includes the length of the segment – it is the average insolation times the segment length.
It turns out there is a problem with this super simple approach: insolation is on the order of 1000 \(W/m^2\), whereas route lengths are on the order of 10 \(m\), which means sun is much more important than distance in the total cost. From experience, I can say that this leads to some very crazy routes. To fix this problem, I rescale the insolation to the range 0 to 1 prior to computing the cost. This amounts to giving distance and insolation equal weights in the cost function. In practice, this generates sane routes so I stopped here, but it would be very interesting to explore what scaling would lead to an “optimal” cost function. Letting \(I\) be the normalized insolation, the sun cost is:
\[\text{sun_cost} = \int_s I \,ds\]Moving on, the “shade cost” term is a bit weirder than the “sun cost”, it is the path integral of the reduction in insolation due to shade along each segment in the transportation network. This is related to the amount of sun avoided by the shade cast on each segment. I compute the shade cost as the difference between the maximum insolation and the observed insolation. Since the insolation is normalized (has a maximum value of 1), this amounts to:
\[\text{shade_cost} = \int_s 1 - I \,ds\]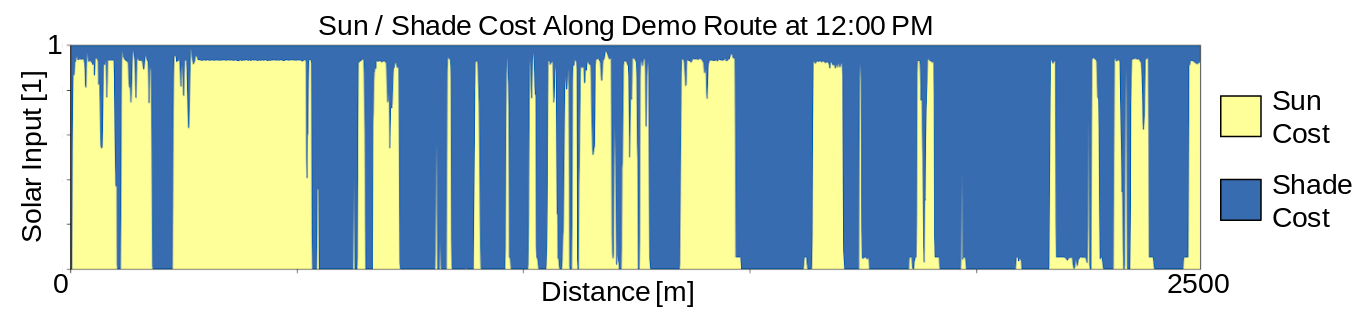
Here is the fun part: if the user sets \(\beta = 0.5\), then we recover the shortest-length path! Working this through shows that the cost in this case is just the path integral of a constant, which is proportional to the length.
\[\begin{align} \text{cost} &= 0.5 \int_s I \,ds + 0.5 \int_s 1 - I \,ds \\ \text{cost} &= 0.5 \int_s I + (1 - I) \,ds \\ \text{cost} &= \int_s 0.5 \,ds \end{align}\]Voila! A single-parameter cost function that allows users to choose sunny or shady routes and still cares about distance.
Routing with a Sun/Shade Cost
The heavy lifting for computing the route is handled by the wonderful PostgreSQL extension, pgRouting. This extension computes least-cost routes using a variety of algorithms (I used Dijkstra) and allows the user to specify the cost as a function of the columns in an OpenStreetMap database. All I had to do was to write the computed sun and shade cost for each segment of the transport network to my database, choose the right column to use based on the time of day, and apply my simple cost equation.
Web App
I won’t go into the details, but I set up the web app using Python and Flask to host an API with endpoints for generating routes, etc., used Leaflet with a few wonderful extensions to build an interactive map, and hosted the sun/shade simulation images using Geoserver.
Next Steps
My biggest hope for Parasol is that the idea catches some traction and gets picked up and integrated into one (or more!) of the many wonderful navigation apps out there in the wild. A few things I had hoped to tackle but ran out of time for are:
- Use sidewalks rather than roads for routing. While OpenStreetMaps includes special tags for sidewalks, coverage is woefully incomplete. This is problematic because Parasol is not able to advise user’s to take advantage of streets where one sidewalk is shady. A few ways to go about this might be (1) trying to synthesize a sidewalk graph, or (2) adjust the sun and shade costs to follow the best side of each street.
- Adjust shade to account for seasonal tree cover. It is definitely possible to identify trees from the LiDAR data, and the shade cast by these trees could be adjusted based on the season. Even better, it is probably possible to use satellite imagery to drive the timing of the change.
- Better raycasting! I used GRASS GIS, which worked fine, but it would likely be better to take advantage of the wonderful machinery that drives modern computer graphics instead. An additional benefit would be that the LiDAR could be converted to a proper 3D model, rather than an elevation grid, and the ray casting could handle the edges of obstructing objects better.